Module 8 Lab: Executive AI strategy brief#
Present a board-ready AI strategy brief.
Lab Context#
This lab uses synthetic initiative portfolio with strategic fit, feasibility, risk, cost, and expected value scores as a safe proxy for the course setting. It is not a substitute for institutional data, but it lets you practice the reasoning, metrics, and documentation pattern before working with real records.
Lab Tasks#
Run the baseline analysis.
Identify the decision the metric supports.
Change one threshold, score weight, or input assumption.
Compare the result before and after your change.
Record one deployment risk that the synthetic data cannot reveal.
import numpy as np
import matplotlib.pyplot as plt
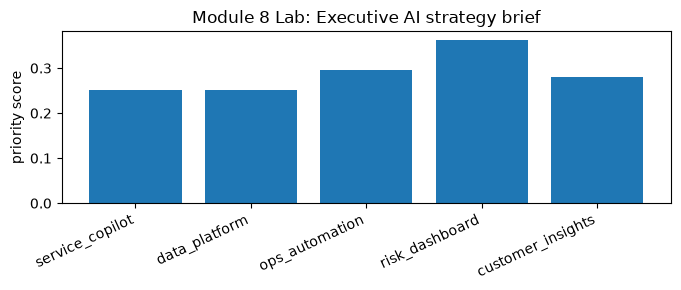
initiatives = np.array(["service_copilot", "data_platform", "ops_automation", "risk_dashboard", "customer_insights"])
strategic_fit = np.array([0.82, 0.74, 0.68, 0.71, 0.77])
feasibility = np.array([0.58, 0.63, 0.72, 0.81, 0.66])
risk = np.array([0.52, 0.35, 0.42, 0.31, 0.48])
cost = np.array([0.70, 0.85, 0.50, 0.44, 0.61])
portfolio_score = 0.35 * strategic_fit + 0.30 * feasibility - 0.20 * risk - 0.15 * cost
ranked = sorted(zip(initiatives, portfolio_score), key=lambda x: x[1], reverse=True)
plt.figure(figsize=(7, 3))
plt.bar(initiatives, portfolio_score)
plt.xticks(rotation=25, ha="right")
plt.ylabel("priority score")
plt.title("Module 8 Lab: Executive AI strategy brief")
plt.tight_layout()
ranked
[(np.str_('risk_dashboard'), np.float64(0.36349999999999993)),
 (np.str_('ops_automation'), np.float64(0.29499999999999993)),
 (np.str_('customer_insights'), np.float64(0.2799999999999999)),
 (np.str_('service_copilot'), np.float64(0.252)),
 (np.str_('data_platform'), np.float64(0.2505))]
reflection = {
    "what_changed": "",
    "metric_before": "",
    "metric_after": "",
    "interpretation": "",
    "synthetic_data_limit": "",
    "next_real_world_evidence_needed": "",
}
reflection
{'what_changed': '',
 'metric_before': '',
 'metric_after': '',
 'interpretation': '',
 'synthetic_data_limit': '',
 'next_real_world_evidence_needed': ''}